 Analytics, Metrics and Music for the Radio Industry
 An Indie Artist Pipeline to Internet Radio
 Radio Industry ROI Strategy
 A New Breed of Indie Artists
Online Radio, Up and Down Rankings
Triton Digital released its "February 2012 Internet Audio Top 20 Rankers." Download an Audio Graphics prepared copy that's complete with charts here. This version goes into much greater detail than the official release (posted here).
Because a number of large webcasters do not subscribe to Triton Digital, it's important to keep in mind that this listing gives only a partial view of the online radio industry.
| "I do the breakout for you, and show how the radio industry is doing online in more detail than is available from any other source." |
There is another item that needs your attention, for this issue of rankers. A number of caveats affect the rankings, so that what you see is not really what was delivered. You'll find these posted at the bottom of the Triton Digital report. They include:  AccuRadio's listing "Does not include mobile data" AccuRadio's listing "Does not include mobile data"  "Slacker: Includes AOL Radio; Numbers are
 understated due to a collection system migration
 during the month of February"
  "Due to a collection node failure in February,
 approximately 4.5% of Pandora listening was
 not accounted for in this report"
|
The above notations mean that the main internet radio pureplay numbers are under-reported. By how much is a guess, but you may infer some information based on these criteria:

 For AccuRadio - Using Audio Graphics' RadioRow as an example, about 10% of total visits come from mobile sources. What you must keep in mind is that AccuRadio is optimized for mobile delivery and RadioRow is not, so it is likely a higher percentage of audience visits AccuRadio (and its numbers would be proportionately higher still).
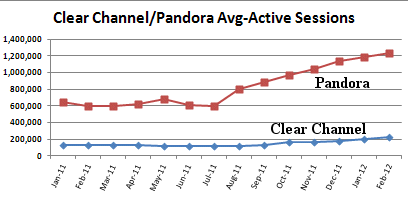
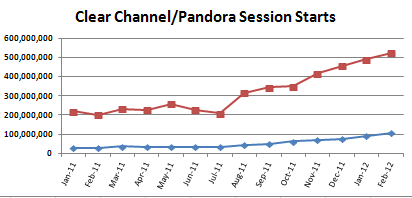
 The approximation of Pandora's listening being 4.5% lower "due to a collection node failure in February" means you'll need to add (approx.) 55,000 to its "Average Active Sessions," and (approx.) 24,000 to its "Session Starts" for the month.
Not enough information is given to extrapolate the Slacker discrepency.
I'll let the charts do the talking from here. First, because we all are witnessing an iHeartRadio attempt to catch Pandora, let's look at a comparison between Pandora and Clear Channel. Note that the CC numbers are inclusive of all online listening, not just what's provided by its iHeartRadio. What's also important is this: unlike past attempts at comparing Pandora to the radio industry as a whole, the charts at least compare Pandora to only one company within.
These graphs represent Mon-Friday Domestic listening:
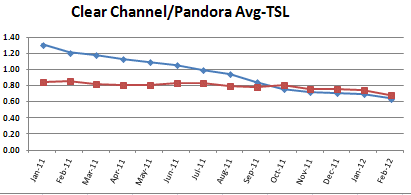
It's obvious that TSL for Pandora and Clear Channel is dropping, which is a matter that needs immediate attention. Because of each company's widely different approach to programming, we cannot draw a direct correlation between the two for such similar declines.
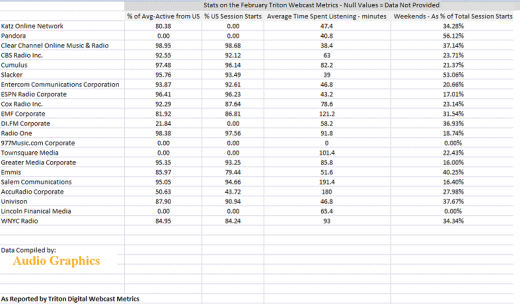
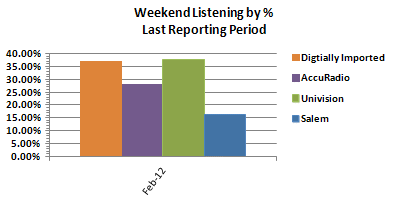
Also based on "Session Starts, here's weekend listening as a percentage of total listening.
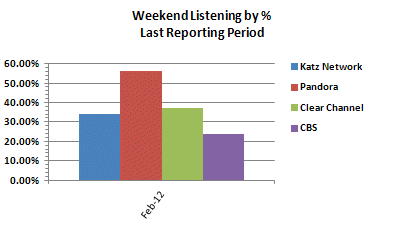
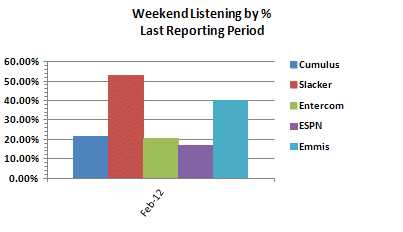
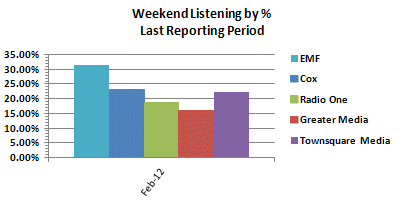
Go here to download your free Audio Graphics analysis of the Triton Digital "February 2012 Internet Audio Top 20 Rankers."
Return to AudioGraphics.com each time there is a new "Internet Audio Top 20 Rankers" released from Triton Digital. I do the breakout for you, and show how the radio industry is doing online in more detail than is available from any other source.
Click here to receive a FREE breakout of this report sent to you for each ranking month. It includes all groups in the publicly released Triton Digital Ranker.


