Wednesday, October 26, 2011
   |
Radio Industry Rankers - From Webcast Metrics®
In what has become an anticipated ritual for the radio industry, Triton Digital released its Webcast Metrics® for September 2011.
The report shows a 7% increase (from August) in Average Active Sessions for its top-20 rankers, a 6.7% boost in Session Starts, and a 5% lift in Time Spent Listening for the top-tiered players subscribing to Triton Digital's audience measuring service.
Pandora has found its footing in the reporting of listening on mobile devices. Its Active Sessions and Session Starts have risen sharply.
| "These collated numbers and charts are from the latest Triton Digital Webcast Metrics®. Download the report, free, here." |
Audio Graphics offers a look at these online radio rankings in a way that you won't find anywhere else, complete with charts for broadcasters and pureplays.
|
Download our free report; you'll not only see, numerically, where the reporting stations/networks sit, but also graphics to lay out the Average Active Sessions, Session Starts, and Average Time Spent Listening for each station/group. These collated numbers and charts are from the latest Triton Digital Webcast Metrics®. Download the report, free, here.
These are four charts (of dozens) included in this free report. They represent the Average Active Domestic Monday-Friday sessions for radio industry and pureplay streams.


|
September Webcast Metrics® Here This data is from the latest report. 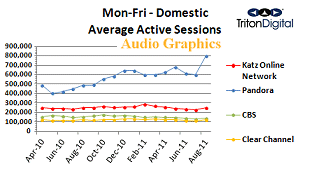
|