| Wednesday, November 6, 2013 |  |
 |
 |
 |
 |
 |
 
 
 |
 |


 A New Breed of Indie Artists
 Free Music and Programs for Radio and Podasters
Radio Industry Needs Number Knowledge
|
Triton Digital released its Webcast Rankings for September 2013. For whatever this is worth, we have seen multiple commentators evaluating what these numbers mean, yet I don't know why because they - both the numbers and commentators - lack context. Unless more variables are introduced, if taken at face value these monthly reports remain a wasteland of data. 
|
"These ratings show companies based in Turkey (Karnaval), Spain (Prisa & Cope), and The Netherlands (Sky Radio B.V.) - some do not stream to the United States." Receive Free Breakouts |
I've said this many times: There's little useful information within publicly-released Triton Digital Webcast Metrics numbers. This is not a condemnation of Triton's effort; individually, the rated companies do derive information from the report. What's released to the public carries less meaning.
The addition or subtraction of stations, unknown variables within each company's data, and a fact that multitudes of very big online radio and music services are not represented means you cannot end up with valuable info from these monthly releases. And you certainly cannot arrive at a conclusion that online radio listening is going up, or down.
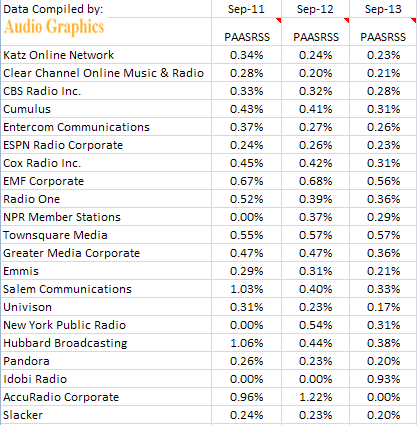
The only item that can be used is the percentage of Average Active Sessions resulting from Stream Starts (PAASRSS) - the numbers of people who start listening and then hang around long enough to be counted as an Active Listener. That needs a little math to calculate, which nobody spends time doing. So we do it here.
Notice how PAASRSS has declined for sixteen of the twenty Webcast Metrics rankers between 2012 and now. As for the four not declining: Clear Channel was the sole "up" to 0.21% in 2013 from 0.20% in September last year; Townsquare Media is flat at 0.57%, while idobi Radio wasn't reported in 2012; and Accuradio's numbers were not available for this September.
Compare 2 years ago with this September's PAASRSS and the drop is extreme in most cases. The only increase is shown by Townsquare Media.

Now, weigh the above with this quote from a radio industry trade owned by Clear Channel: Inside Radio states, "Primetime web listening grew in September." It goes on with "Average Active Sessions for the primetime Monday-Friday, 6am-8pm daypart grew 5.43% from August to September, according to Triton Digital." Why does no one inside radio question the veracity of such a statement, or point to its data holes?
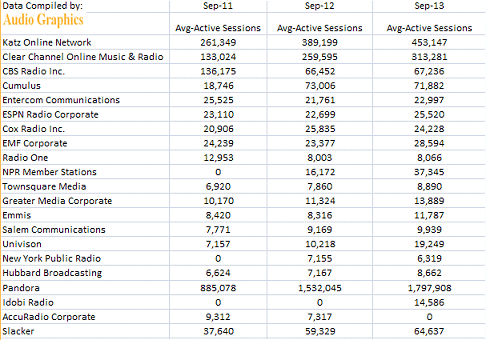
Example: From the Mon-Fri Domestic Report, August 2013 showed 2,544,102 as the "Average Active Session" of those companies reported. In September 2013, of the companies reported, "AAS" was at 2,555,015. Care to check that increase and you'll find it's 0.43%, not 5.43%.
These ratings show companies based in Turkey (Karnaval), Spain (Prisa & Cope), and The Netherlands (Sky Radio B.V.) - some do not stream to the United States. I left these companies out of the charts here, but if you wish to receive a full report, subscribe to our free assessment.
Average Active Sessions - Average Active Sessions (AAS) is defined as "Total Listening Hours (TLH) divided by hours in the reported time period."

(These numbers represent cumulative hours of listening - not people.)
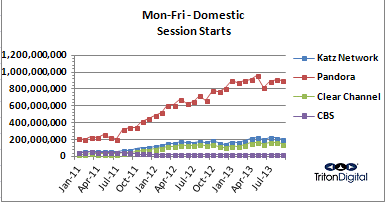
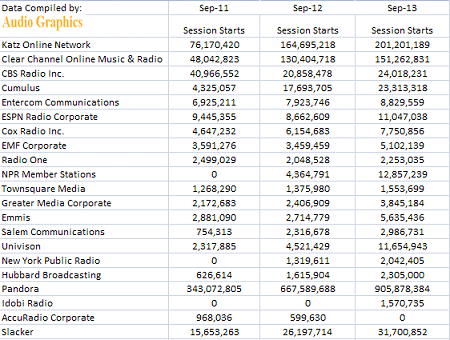
Session Starts - Session Starts (SS) is defined as "the number of different requests for streams (i.e., stream requests) with a duration of at least one minute in total within the reported time period."

The radio industry is infatuated with numbers; and ratings seem to be the guideline, whether or not the data shows anything useful.
With every release of Webcast Metrics, many involved with radio online point to how its data reflects growth. However, they may as well be pointing to their navel - which shows about the same level of guidance and information relative to what's happening online for the radio industry at large.
Online and off, the radio industry needs to increase its knowledge about Webcast Metrics' numbers.
Click here to receive a FREE breakout of this report for each month it is published. Audio Graphics' compiled numbers include all groups in the publicly-released Triton Digital report.
Note: For caveats pertaining to this month's release, please view the bottom of Triton Digital's report.
Today's indie artist introduction is to...
| Spiritual music artist Skylar Kaylyn. |
 sample song |
Happy Ever After Download Song
|
Give Skylar Kaylyn's "Happy Ever After" a listen.
Add it to your playlist, free! Such is the new world of music distribution.
It's time for internet radio programmers to take a chance and reach into a huge pile of new talent. Online is where new hit songs will increasingly be found.
More Articles
 |
 |
 |
comments by Disqus |

