|
Survey 51 Topics:
Info Sources for Local Sales
Mobile Phone Use
Doing "Less Of" List

Survey 51 explores how people use media to find local "sales." Participants responded to this:
From the list below, select your top source of information on what's for sale in the market where you live.
|
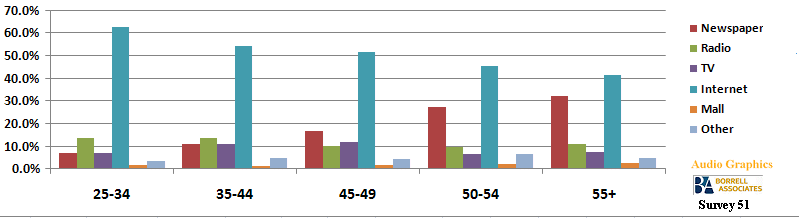
The age groups agree that the internet is used far more than other options when finding "what's for sale" locally: 57.9% of 25-44 and 44.1% of 45+
The closest any traditional way comes to those figures is in the category of newspapers, with 28.3% of the 45+ group reporting usage.
As vehicles for finding "what's for sale where you live," TV, radio, and newspapers are choices representing well under 20% for 25-44 year olds.
|
TV
9.2% of 25-44
7.8% - 45+
|
Radio
13.4% of 25-44
10.4% - 45+
|
Newspapers
9.2% of 25-44
28.3% - 45+
|
Every day we read how quickly mobile phone use is growing. The next questions show how much of an impact they are having.
In an average week, how has your use of a mobile phone changed
compared with your usage in an average week 12 months ago?
There is not much variation between age groups in pattern of use.
|
Have your station serve this Audio Graphics/Borrell Associates survey.
Survey-serving stations share the data, and help internet radio establish a baseline for comparing its value to other media.
We ask 3 questions; after receiving 1,000+ responses, 3 different questions are then displayed.
Each survey is branded to the serving station.

|
|
|
Surveys are branded to the serving station.
See
Survey 50
Of Those Who Saw Mobile Use Increase...
35% of respondents reported that their mobile phone use increased from that of last year. To find the activity which received less time, we asked this group:
If your usage of a mobile phone has increased in the past 12 months, select the top activity that you are doing less of as a result.
The percentage of disruption for each category remained close in both groups. Watching television was identified as the activity losing the most time to mobile phone usage.
The surprise here is that both demo groups reported giving up more time with family than friends, as shown below.
|
|
|
25-44 |
|
45+ |
|
Give Up Family Time |
|
7.8% |
|
6.1% |
|
Give Up Friend's Time |
|
4.2% |
|
2.5% |
About These Surveys
Audio Graphics started this internet radio listener
survey system in October 2002. It is the only continuous
survey of the internet radio audience and is conducted
in conjunction with leading research firm
Borrell Associates.
For more information: Ken Dardis
440-564-7437
Survey 51 Participating Stations:
|
|