| Thursday, April 4, 2013 |  |
 |
 |
 |
 |
 |
 
 
 |
 |


 A New Breed of Indie Artists
 Free Music and Programs for Radio and Podasters
Radio Industry MisReading Its Data
|
We have new numbers put before us by Triton Digital in the February Webcast Metrics released yesterday. As in previous months, if all you read are radio industry trades, you'll be getting a fuzzy picture of what's represented in the report. Reading over trade reports the only "fact" you can place faith in is "Average Time Spent Listening." That's because it's an absolute, solely dependent on the "average" TSL (and not affected by the addition or loss of client stations). |
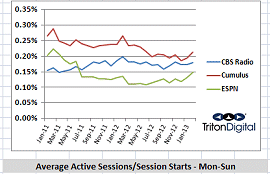
"Both charts show good news that Average Active Sessions increased from January-February when presented as a percentage of session starts." Receive Free Breakouts |
But when you come across statements like "Average Active Sessions have grown by a third in the last year (up 34%)," throw that number away. The reason is simple. Average Active Session growth or loss can be determined by the number of client stations using the Triton service - it doesn't mean that online radio is growing or shrinking.
If you wish, though, see Triton Digital Webcast Metrics charted in ways unavailable to you from any other source. View them in detail in our free report.
Now, view this chart before moving on
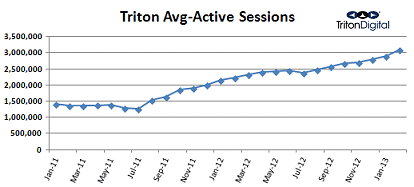
In one radio industry trade, you'll find this jewel of a comment: "Triton found a modest six percent growth from January to February."
This is also useless dribble: As described above, is "growth" from Triton adding client stations or because of a rise in the numbers of people who started sessions and then hung around the same number of stations? Without definition, these are words that sound good but carry no meaning.
In another trade the quote goes: "Between February 2012 and February 2013, desktop listening, measured by Active Sessions, grew 5%. While mobile listening exploded at a 43% rate." The first half of this is pointless data, as are nearly all "Average Active Session" and "Session Starts" comparatives. The second half of the quote has only a part resting in reality because it heavily depends on the effort client stations exert in pushing audience to mobile (think "iHeartRadio" promotions).
If you care to compare, Audio Graphics' RadioRow shows 11.75% of its March 2012 visitors accessed through mobile devices. In March 2013, that figure rose to 26.48%. RadioRow data rests solely on consumer activity, with no promotional influence.
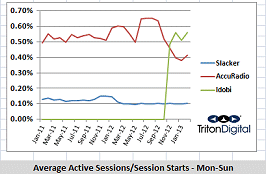
Here is something else to digest. The following are graphs representing the "Percentage of Average Active Sessions Resulting from Stream Starts." Through it you can tell if people are sticking around after tuning in - without a nebulous mention of the numbers of people (because, unless defined, the "number of" anything carries no meaning).
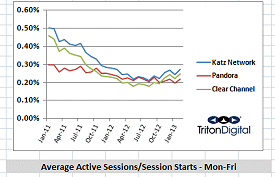
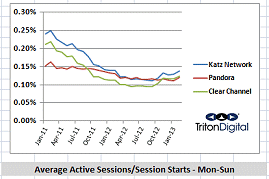
Both of the above charts show that Average Active Sessions increased from January-February when presented as a percentage of session starts. This means that people are hanging in there longer - and this figure has no attachment to whether Triton Digital added or lost client stations (or if any of the client groups added or lost stations).
While good news, make note that Monday-Friday percentages are nearly double those of Monday-Sunday. There is a lot more sampling happening on weekends.
The same "good news" results are shown for other top radio industry players and the top pure plays subscribing to Triton's Webcast Metrics.
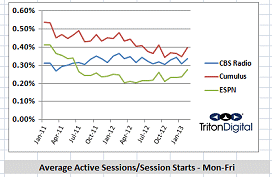

If you want to digest these numbers, subscribe to our free breakout. You'll see graphs for each of the top companies charted in ways unavailable to you from any other source.
You'll also receive spreadsheets outlining the "Percentage of Average Active Sessions Resulting from Stream Starts."
Click here to receive a FREE breakout of this report sent to you for each month it is published. The Audio Graphics compiled numbers include all groups in the publicly-released Triton Digital Ranker.
Note: For caveats pertaining to this month's release, please view the bottom of Triton Digital's report.
While the broadcast side of radio has a near lockout on indie artists, introducing music is open wide to internet stations.
|
A Country artist to consider: Paul Tolle. |
 sample song |
Cougar Snack Download Song
|
Give Paul Tolle's "Cougar Snack" a listen.
Add it to your playlist, free! Such is the new world of music distribution.
The radio industry had its shot. It's time internet radio programmers take a chance and reach into a huge pile of talent. It is there that new hit songs will increasingly be found.
More Articles
 |
 |
 |
comments by Disqus |


